top of page

Isaac Elliott

Data Analyst

How can we make it better?  This question has always been my principle since day one of my data analytics career.  As we approach a data filled world, there are still much to discover accumulating various insights through the use of our data.

Experience

Research Analytics Intern

@Entreprov

January 2018 - July 2018

  • Provided business intelligence regarding pricing schedules to a charterbus company/client

  • Created KPI reports using Excel dropdowns, pivot tables, and macros

  • Created reports for a Charterbus services company using exploratory data analysis using python matplotlib visualizations

  • Specified industry Gross Profit Margin reports for company growth

  • Contributed to a team of analysts regarding several data governance issues regarding GDPR and data privacy policies

Data Analyst (contractor)

@Ryan Kaufman

November 2016 - July 2017

  • Cleaned and formatted spreadsheets for upload to database platforms by using vlookup and pivot tables in Excel

  • Troubleshooted data inaccuracies that led to a more effective data upload implementation to CRM platform

  • Provided dashboard creation regarding click sessions from Google Analytics

  • Effectively communicated on Key Performance Indicator reports on review click data

CRM Database Analyst

@TCS World Travel

February 2015 - December 2016

  • Create various on-demand and scheduled reports for different departments

  • Clean and optimize data from SalesForce, and SAP WebIntelligence

  • Query data using SQL, Salesforce, Hubspot, and SAP WebIntelligence

  • Strong understanding of analytics fundamentals and business practice

  • Cross functional communication among the Marketing, and Sales teams for CRM Data

PROJECTS

ppax demographics.png

Customer Demographics

This report was created using a combination of tableau and Excel using pivot tables. This map reflects the density of past customers through zip code. The bigger circle areas are the number of past passengers living within the zip code. These are past customers that are subscribed to mail only. It does not reflect every past customer, only those that are subscribed by mail.

dashboard creation.png

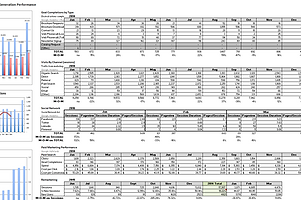
Month over Month KPI dashboard

An Excel Dashboard to design a regarding month over month and year over year, timeline regarding Click rate sessions using Google Analytics

Logistic kaggle.PNG

Predictive Analytics

Logistic Regression

To predict future pokemon battles. The objective is to use logistic regression to predict the probability whether if the first pokemon can win against the other pokemon in future battles.

This applies several machine learning techniques and a model that accurately predicts various binary outcomes. Although the objective may sound silly, but could potentially have a great impact in predicting binary probabilities.

©2018 BY IS IT REALLY DATA SCIENCE?. PROUDLY CREATED WITH WIX.COM

bottom of page